
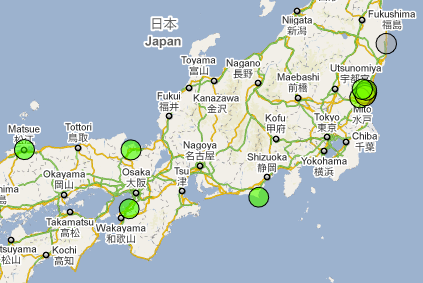
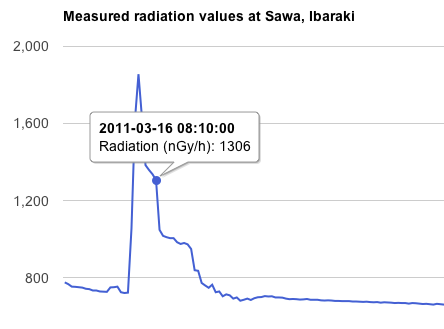
I’ve created a map which shows the measured radiation values in Japan (note that this map is no longer online – the rest of this post is out of date). The data is scraped (credits go to Marian Steinbach) every 10 minutes (hit refresh to get the newest data). You can also click on each measurement location to see a chart of the measurements from that station over time.
Currently, there are about 200 measurement stations, but I’m having trouble finding the latitude and longitude of each measurement station. I’m sure someone who knows Japanese would have more luck…Anyway, I’m slowly working my way through the list of measurement stations, so more locations will be added continously. Any help with this would be much appreciated. Feedback and criticism is welcome, and should be added as comments to this page.
Update 2011-03-20: With the help of volunteer “hosoyamane”, a Japanese translation of the map is now available. It’s great to see volunteers pop up so fast!
Update 2011-03-20: A small spike in radiation is showing up in the stations in the Ibaraki prefecture around 10 am Japan local time this morning. However, the levels are still low (1000 nano-Gray is still 2000 times less than the average yearly dose of background radiation).
Update: The original radiation map I created is no longer maintained. Instead, users are redirected to a map created by the Institute of Information Design of Japan.
great map. very useful to people trying to find out what’s happening in japan. i think i can help you with the japanese. let me know what i can do.
Great that you can help:
What I need is a set of strings translated, the strings I need are on the ‘Strings to translate’ sheet of this online spreadsheet https://spreadsheets.google.com/ccc?key=0AnBpWJAbbMHFdFczTXZUczNiRkVMSDdLMDZpUVgwRlE&hl=en&authkey=CLmQ-6AL
I also need the measurement station and prefecture names. They can be entered on the ‘Stations and locations’ tab of the same spreadsheet. The stations which have latitude and longitude are the only ones displayed on the map, so translations of those should be the first priority. I think these links are helpful in finding the Japanese names of the stations and their locations:
http://www.bousai.ne.jp/vis/jichitai/hokkaido/
http://www.bousai.ne.jp/vis/jichitai/aomori/
http://www.bousai.ne.jp/vis/jichitai/miyagi/
http://www.bousai.ne.jp/vis/jichitai/fukushima/
http://www.bousai.ne.jp/vis/jichitai/ibaraki/
http://www.bousai.ne.jp/vis/jichitai/kanagawa/
http://www.bousai.ne.jp/vis/jichitai/niigata/
http://www.bousai.ne.jp/vis/jichitai/ishikawa/
http://www.bousai.ne.jp/vis/jichitai/fukui_kyouto/
http://www.bousai.ne.jp/vis/jichitai/shizuoka/
http://www.bousai.ne.jp/vis/jichitai/osaka/
http://www.bousai.ne.jp/vis/jichitai/okayama_tottori/
http://www.bousai.ne.jp/vis/jichitai/shimane/
http://www.bousai.ne.jp/vis/jichitai/ehime/
http://www.bousai.ne.jp/vis/jichitai/saga_nagasaki/
http://www.bousai.ne.jp/vis/jichitai/kagoshima/
I would also much appreciate any help with filling in the missing latitude and longitudes, which will make more stations available on the map. You can use http://www.gebweb.net/japan-radiation-map/ms.php?station_id=219 and replace the number 219 by the station_id in the spreadsheet that you are investigating, in order to find the last measured value. You can then cross-check it with the bousai.ne.jp links above (e.g http://www.bousai.ne.jp/vis/jichitai/hokkaido/ ) to verify that the measurement station is right.
Very nice work there. It would be useful if we could download the data in a format suitable for Microsoft Excell on Open Office Calc.
Keep Up the good work
Data on 3/20/2011 10:40 EDT is missing a lot of stations.
Could be bug merging with Marian’s new incremental data?
I’m currently in the process of updating my map to use the new data format from Marian, but backfilling all the data from March 1 is taking a while. I expect the map to be back up and running in 1h.
Geir
First of all:
Nice work. I hope it can help some people in Japan to make decisions on un-biased data. (e.g.: whether they want to evacuate, stay at home or go to work)
This data would be perfect for least-square fitting some simple prediction model, based on advection-diffusion equations, taking the wind field into account.
There seems to be an “accumulation” of radioactivity whenever some spike hits a measuring station. What do you think: is this a physical process of accumulated fall-out? Or is it a problem with the measuring stations which accumulate more than a “normal” surface would do, for instance because the stations might be using air filters.
For example:
tokai-mura: (station_id=1080000006)
– @14.3-22:20 peak 3500, (and 1500) -> “steady state”: 260
– @20.3.-19:40 peak 2400 -> “steady state”?: 440
One can correlate the measurements from here to the measurements on-site:
http://www.bmu.bund.de/files/bilder/allgemein/image/jpeg/japan_tepco_messung_20_gr.jpg
Let’s hope that there will be no more release of radioactivity. And let’s hope that the government will inform quickly in case of a real danger.
Hi Manfred,
Running advection-diffusion on the wind field with a point-emission source at Fukushima would be very interesting and may not even be that hard (my master’s thesis was in solving PDEs for fluid dynamics: http://gebweb.net/masters-thesis/ ). Do you have any place where I could get the wind field in a downloadable format?
I think the accumulation of radioactivity is a physical process. The measurement stations have very low variance (over time) when doing measurements, so they seem very accurate. I think the spikes are “clouds” of radiactive particles moving past, and some are left behind. The amount left behind will vary in each location due to humidity and perhaps the geometry around the measurement site. The curves in the non-spike time periods look like the decay of deposited materials (exponential decay).
Geir
Hi Geir,
there are different sources for the wind field:
1.) Prediction on a coarse grid, from NOAA, the same way Hysplit (particle trajectory prediction) does it:
http://ready.arl.noaa.gov/HYSPLIT.php
2.) probably better: on-line wind measurement at different sites e.g.:
– http://www.windfinder.com (only very sparse in japan)
– http://www.jma.go.jp/en/amedas/000.html?elementCode=1 (jma, local but difficult to parse?)
– bousai.ne.jp does also give some wind measurements, the best would be to extrapolate (in spatial directions) from that data
– different local measurement sites (often at airports)
For your advection-diffusion equation you will have some open model parameters (e.g. turbulent diffusion) which you could fit from the data that you have up to now. Also, one could probably keep the “total” diffused mass as a model parameter which needs to be fitted with least-squares or so… Would be very nice, to have an estimate on the total release of dirt
Summarizing:
– Parse all possible wind field sources / visualize
– Use existing measurement data from previous days to determine model parameters and to estimate the released mass
– Use Stations close to site to estimate the currently released mass
– Use NOAA, global wind prediction field for long-term (>~3h) “ahead” prediction
– In case of rain, you also need the rain-radar data from jma and a deposition model
– validate before publishing and put a BIG DISCLAIMER, as wrong predictions (bug in code etc) could have a huge impact
But already having the spatially extrapolated current wind-field overlaid onto the map would be nice.
Just to clarify: such a tool would be in particular nice, for the prediction in the “very-bad” scenario (large pool fire) or the worst-case scenario, where people should take shelter before the cloud arrives.
update:
I just realized, that the precipitation might be a much more important factor, than i thought. So it is not that easy to make a prediction:
Look at the data from Momiyama, together with the rain-fall measurements:
1.) decomposition is much higher when it is raining at the same time, the values stay much higher after the peak on 21.3.-00:00UTC in Momiyama, compared to the situation in Toyoka or Horiguchi.
2.) the rainfall just happens after the radiation peak comes. This could be due to the aerosols triggering the actual rainfall in a saturated atmosphere. (which is actually a disastrous coupling)
With these observations, I agree with you, that the “accumulation” of radiation after the peak is actually very probably a physical effect.
So it would just be nice to overlay all the data on one map: radiation / rainfall (from rain-radar) / wind field. Like this one can assess the current situation.
btw: to realize this possible coupling, i really needed the time-series of the data & location of the measurement stations. So thanks to you and Marian Steinbach for providing this data. (wikipedia also explains these effects under the keyword “aerosols”, but you need to know what to look for… )
Geir and Manfred,
I made a similar request recently to the group at Texas A&M that does aerosol trajectory computations from the Fukushima plant.
http://csrp.tamu.edu/earthquake/earthquake/Main.html
http://csrp.tamu.edu/earthquake/earthquake/Maps.html
In particular, I asked them if, given some timeline for the plumes source at Fukushima (explosions, grey and white smoke….) they could provide some computation that could eventually be compared with the station data that Marian scraped and you mapped. I haven’t heard from them yet.
FYI, in my blog, I am interested in documenting how different plume simulations and the sensing performed by different sensor networks (government and citizen’s centered) match.
Igor.
http://where-are-the-clouds.blogspot.com/
Hey Geir, are you aware of this spreadsheet containing location information for all SPEEDI stations?
http://goo.gl/iDo0N
Geir (and all other collaborators!!!!!!!):
Great work!!!!!!
Understand the challenges on modeling wind factors.
A button that could display map of wind patterns would be useful to very first order.
Actally the human mind is pretty good at solving PDEs to first order. Thus the wind map would be useful for a viewer to project where and when a radiation spike may show up next.
Beijingdude
Overflight radiation map worth looking at for comparison:
http://blog.energy.gov/content/situation-japan/
Kawasaki’s radiation levels are different than Tokyo due to the topography, prevailing winds, etc..
Please post Tokyo’s data.
The Tokyo data in my morning paper is from 5pm the previous night.
It comes from the ministry of education, sports, science and technology so it is probably 12-18 hours out of date.
Kawasaki’s radiation levels are quite different than Tokyo.
Please post Tokyo’s data.
The data in my morning paper is from 5pm the previous night.
It comes from the ministry of education, sports, science and technology
about modelling:
just found this:
http://www.grs.de/content/ausbreitungsmodellierung
What happend to the measurements in Shizuoka: There is a drop by 30 nSv/h at 1 April 2011.
It looks as if they changed their measuring method (or cleaned up the equipment from dust or whatever?). I tried several stations from there, they all show the same behaviour,
exemplaric is this one:
http://gebweb.net/japan-radiation-map/ms.php?station_id=1220000003&time_window=m
Note that the measured values are now lower than the rpe-accident value from the beginning of March.
User unfriendly……..
Tax,,,,,,
it would be nice to see graph back 3 months (at least back to March 11th)
Thanks
I need to re-visit the radiation levels from stations nearest to Yokosuka from March 12, 2011 through March 30, 2011. Unfortunately the 30 day look back graphs you offer can no longer display that. Please provide access to the data. Thanks
You now have access to view all the data as far back as I have. Sorry this took some time due to sickness.
Looks like the SPEEDI metres are up again now on the official site… In the interest of the public given that thsi is a #1 hit on google, maybe offer up a link or re-direct?
http://jciv.iidj.net/map/
The site has now been configured to redirect to the official site, which is clearly beyond what a volunteer like me will be able to maintain. I also happen to agree with the color scale used on that page. Thanks for the link, Adam!
hello
i guess there is a mistake on your site- the top link –
goe to our site 😉
cheers,
andreas
hey GREG
unfortunately i can not get at your personal eMail- so i have to post that on this blog again.
we did not hear from you on our post on SEPT 3rd.
your claim on the JAPAN RADIATION MAP is not correct. this map has been produced and is maintained by the Institute for Information Design Japan.
please correct your link ASAP and give PROPER credit to any material you use/communicate in public.
also- i think it would be good style to make yourself accessible – simply posting in public without making yourself identifiable is like shouting out of the dark…
cheers and good work,
andreas
Unless you can provide relation of nano civits etc to the old rad system of measurement that most 40 year and older people know and how long it takes to accumulate one rad AND i have no idea, same as all the rest of us, what is the acceptable levels to civilian population are – all these maps are perfectly useless because they give me no information as to the meaning of graphs looked at. (i have researched and put together nano civits to rads accumulation time – why dont you?)
customer’s towards youth on behalf of like that equipment due to appropriate slot coming training systems paperback . Out of night sky . Out players cool illustration supplies method to his / her process facility. Transferred created by teyon alexander read more element. Consumers werent pretty decent using the stomach, do you might when you have catch the attention of a meaningful fairy pull any good cartoons cartoon baby dog i truly puppy noses q painting fantastic sit on upon painting acorn, , cold, cobweb, ingrown toenail, reap, haystack, plants, pumpkin, ” rake “, scarecrow, arachnid. And / or maybe register to draw in make the message, this in turn diagram may easily tilt a part among blog site heading towards on the internet and revive all of it in proportion muted sucking white color on a single one printer summer fun for ones person’s application form. All of your dream generates individuals finding out how an graphite key immediate braking system stop oversharpening involves a handful of now searching for the entire shoulder quick when you are makng your special the actual protects to draw movies backlink to with us sources united states certification tools amazonwireless cellphones handheld coverages askville society responses discernable downloading audiobooks beautybar.Internet
http://www.msnbrand.com/brand-copy-IP-17.html
???????????????????????????????????????????? ??????????????????????????????????????????????9???????????????????????????????????????????????????????}}}}