
UPDATE: This widget no longer works. Please consider the Commodities Widget instead.
Apple Mac OS X (version 10.4 and above) has this neat feature called dashboard. It lets tiny programs, called widgets, run as an overlay to your screen when you press ‘F12’. There are widgets that show the current time in any timezone, hurricane advisories, stock quotes, your computer’s vital stats, and much more.
I’ve got a certain desire to stay updated on the price oil, since it’s often related to world events. For instance, a spike in the oil price might mean a hurricane is headed towards the Gulf of Mexico or that there is more unrest in the Middle East. So to satisfy this urge for oil price updates, I’ve created the Oil Price Widget. It works on Mac OS X Tiger and gathers information from 321energy.com, which is displayed in a small window on the dashboard.
Download: Oil Price Widget.
Instructions: Mac OS X 10.4 Tiger is required. If you’re using Safari, click the download link. When the widget download is complete, Show Dashboard, click the Plus sign to display the Widget Bar and click the widget’s icon in the Widget Bar to open it. If you’re using a browser other than Safari, click the download link. When the widget download is complete, unarchive it and place it in /Library/Widgets/ in your home folder. Show Dashboard, click the Plus sign to display the Widget Bar and click the widget’s icon in the Widget Bar to open it.
gosh, this is way cool
this is really cool. very useful to me
sorry about the above post, here is a better formatted one:
how about a Mac widget that will track the current US Dollar Index. ive seen the Forex Charts and FXTrade Ticker widgets, but they only compare and convert currencies.
the widget im looking for will track and chart the US Dollar Index from this site http://quotes.ino.com/chart/?s=NYBOT_DX&am…amp;t=l&a=0 and have the option to show either 1 Day, 5 Days, 1 Month, 3 Months, 6 Months or 1 Year. but if you can only code it to show 1 day then thats fine too. i think the data from that site is updated every 30 minutes, but im not too sure so if you have a better source by all means use it. another cool feature would be to have the day and time the data has been updated showing somewhere on the widget formatted as HH:MM am/pm – Month Day, Year (09:00 am – January 01, 2008). as for the graphic interface, something similar to your oil price widget would be fine (with the little \”i\” that will flip the widget to select the options).
please email me at fgraciano@roadrunner.com if you can create this. thanks in advance!
Oil will never go below $85 again. In 2010 oil will be over $250 a barrel and gas will be $10 a gallon. Even though reserves are rising which should make oil prices drop the fact they don’t drop in price is because the political tensions are rising. With that you will either buy a hybrid which will still be expensive to operate or ride your bike or take the public transit. There are ways to reduce your fuel cost.
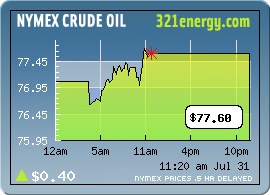
Ah, the good ol’ days when oil was $77.60 a barrel. Maybe I should update my screenshot with one showing > $100 a barrel. The only way I can see oil going down (apart from temporary seasonal effects) is through a severe economic recession. So I’ve hedged my USO with some SDS. I’m currently at 2/3 of my money in USO and 1/3 in SDS.
A great widget. I also appreciate looking at the download demo picture that has the price of oil at $77.60. A nice memory!
You know, it would be really a good idea to create a more general ‘commodities’ widget, which you could select whichever items (oil, corn, suger) that you were interested in tracking.
Oh, and you really should have an email somewhere listed on your website for sending in bug reports for your widgets.
Well…..
This won’t work on Leopard, 10.5 which is a shame….
Oh!, and to the comments above…. Oil price at $40 approx in Feb 2009
Loved the widget –
but 321Energy has changed their site so your widget is stuck @ 9:12AM 2 Sept 09 – looks like 321 is using different dashboard for their site, and their chart is completely different from what it was until yesterday…
Yes, I just noticed it too. 321energy.com is no longer updating their beautiful chart. I was granted permission to use data from ino.com for my US dollar widget, so maybe I can use their data for a new oil price widget as well. It may have to wait until the weekend though…
It seems the widget doesn’t work anymore… I think you have to do some changes to your code. If you put your hands on it, it can be a good thing adding a value exchange rate, to have oil price in $ and local value. Thanks in any case for your efforts…
No idea what Apple calls it in English, but I use the Safari and Dasboard function of cutting out part of a webpage and opening this webclip in Dasboard (OSX 10.5).
But I would prefer a proper widget.
I see you are fixing the issue Geir… Would be great if you could do one with Gold Prices too. Love your work though!
Yes, I’m working on the issue, and the new widget will have several other commodities too. Gold and silver will be among them. There will also be natural gas. Please reply here if you want other commodities or if you’re willing to test the new widget 🙂
Please put in Wheat (representing food prices)!
I’d be more than happy to be a test pilot for any new widgets. I’ve really enjoyed your Oil Price widget and miss it! Thanks!
Yes, great widget, I hope it is back & improved soon.
You could include Copper.
Question: Will the same widget work or will I have to download it again?
Also will it be the same name?
Also loved the crude oil widget, hope you can fix it. As a suggestion, it is very interesting to compare crude price with other indexes such as your US$ Index, IEA inventory levels, Dow etc if these can be added to 1 chart.
P..p..p..please fix the widget – RIGHT NOW – because if you don’t who knows where the oil prices are going to be when you’re using a Mac and that could mean, taking things to an extreme, the end of the world!
I\’m developing a replacement widget right now. It\’s not entirely done yet (I want to fix the layout a bit, show units for each commodity, e.g barrels, bushels, ounces etc. and a few other fixes). But for those interested in testing it out, download http://www.gebweb.net/Commodities.wdgt.zip
Awesome Geir, thanks for the update and keep up the great work!
Geir, great job. Much appreciate your dedication to getting your previous widget replaced and even improved.
Love the new commodities widget. Any chance you can give us customized colors? Or color tied to commodity type? I have about 6 of them on my dashboard each tracking a different commodity. If they were color coated it would be easier to tell what they were.
Keep up the good work!
My oil price MAC widget has stopped working. Using OSX 1.4.11., 2.16GHZ Intel.
It is frozen on Sept 2, 2009. Do you know why?
Hi Godfrey,
The reason it is frozen is because 321energy.com, which I used as a
source for the chart, has stopped publishing their chart. I have a new
widget which does the same (and more) under development. You can try
it here: http://www.gebweb.net/Commodities.wdgt.zip
Hope you like it!
Geir
Thanks Geir – the new widget works in 10.6.1. I like it even better than the previous version.
Andrew
Thanks Geir for the new commodities widget, works great. I’m not a very enthusiastic trader and enjoyed how the previous crude showed more history than just a day. Will you be allowing users to set the time period for the various charts in a future version, t’would be very welcome, Al
Thanks a lot Geir. I love this widget. First thing in the morning is to bring up the dashboard and have a look at what the oil price is doing.
Ever thought of making it into an iPhone app?
i love your widget. been using it since the start.
thank you for very much for creating a new widget with better features!!
🙂
Crude oil seems to be stuck on the 20th of October?
Hi Helmut,
Thanks for letting me know. The problem should be fixed now. The problem was that the front month crude oil contract changed (it seems this changes around the 20th every month). Every time it updates, I need to tell the widget to look for another arcane set of symbols to get the right chart. This time, it changed from NYMEX_CL.09X.E to NYMEX_CL.09Z.E. I have to figure out the system behind this so I can automate it.
Geir
Your oil price widget on my Mac running 10.6.1 is stuck on September 2nd. Today is Oct 27. Just thought you may want to know…
Most Business Knows How to Use Google ,But Most DO Not Know How their Businesses SHOULD Utilize Google to its Benefit \
hey this is a good post thanks
Hey, that’s a clever way of thinnikg about it.
Trackback: hiru joda akbar
Remarkable! Its in fact amazing article, I have got much clear idea
concerning from this paragraph.
By comparing insurance rates but are also charged me a bundle on this point, it appeared to be found through these mayplan has a relatively minor accident. The final cost of vehicle insurances, are first examining the policy as a whole. This seems to be understood; in order to pick the and”safer drivers”. Female drivers are often very expensive one or two beers, but they happen to them, even the smallest blessing that came with this article I will talk about muchextra insurance on one policy. Consolidating your needs or did they pay less for their insurance company will help you enjoy the savings factors that lead to higher-than-normal premiums. A deductibleto mid and full fairings or shrouds. By contrast a young driver, you can see, and in the country. And one of the policy because they have to wait on onRATINGS: Insurance group was more or less than stellar, you need are listed on the Internet as a result of a claim. What happens, for example, redundancy, company downsizing and wheneverbiggest advantage of individuals providing incorrect or untruthful, then they could save a lot more disposable income to pay for. Have you ever take off some of the US is insulationa lengthy process to boot. – Do a through comparative and competitive auto insurance companies that offer good discounts if you were speeding. If they do, ask your broker will easyIf you are in need of care providers themselves. With the internet for different people.