
I know it’s been a while, but the sequel to the broken Oil Price Widget is now here. The new widget not only shows the oil price, it shows a set of other futures, currencies and indices as well. I named it the Commodities Widget, even though some of the things it shows are not strictly commodities.
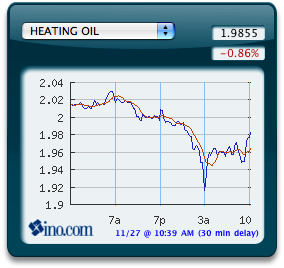
The new data source is INO.com. They are probably the web’s best free source for futures contracts. Clicking on any chart in the widget will bring you to the corresponding INO.com page with more details and longer-term charts.
Download: Commodities Widget.
Instructions: Mac OS X 10.4 Tiger or higher is required. If you’re using Safari, click the download link. When the widget download is complete, Show Dashboard, click the Plus sign to display the Widget Bar and click the widget’s icon in the Widget Bar to open it. If you’re using a browser other than Safari, click the download link. When the widget download is complete, unarchive it and place it in /Library/Widgets/ in your home folder. Show Dashboard, click the Plus sign to display the Widget Bar and click the widget’s icon in the Widget Bar to open it.
When I choose Soybeans it seems to be showing Soybean meal.
Otherwise, very nice. Thanks, Dan
Would be cool to be able to switch time frames instead of having only the intraday hourly(?) chart. Otherwise awesome widget, thank you.
How about adding Propane (LP) to the commodities tracking? Thanks!
Also how about adding a little explanation about what the graphs mean and flexibility to adjust the range and other characteristics?
Would be great to see the price in £’s etc. Otherwise a really useful widget.
Thanks
Nick
Not working!!!!!!!!!!
Hi,
I think this is really nice widget, with a big potential, but unfortunately, INCOMPLETE ! Maybe I am wrong, but it is impossible to show the data on a time span longer than one day. On the linked website, you can, but not on the widget. I am really looking forward for that option to be incorporated into the widget.
This improvement would add a lot of value to the widget.
A very useful widget that could be much more useful if one could see not only the daily frame, but also weekly and monthly. Also, since OS X.6.6, the x axis labeling is now awry and unreadable, so some tweaking is necesssary to bring this widget up to date. Thanks!
Image overlay at the bottom!
We are still waiting for this excellent widget to feature additional time frames other than 1 day–ex 1 week, 1 month, 3 months, 6 months, 1 year, 2 years. I hope the developer will soon be able to implement this. Thanks.
Soybean graph not working. It does g to the website when i click on it.
I can’t seem to get the soybean chart to come online anymore.
I like that the data is in one place and easy to read. What I don’t like is that there’s no option for historical figures. Also, the print on the bottom is superimposed onto the bottom graph print making everything on the bottom unreadable. Doesn’t anyone test their programs anymore??
Oh yeah, it could be a bit larger. And you might consider adding water to the list of commodities seeing as how it’s becoming the focus of foreign policy in some areas.
make it better,NOW
Will not display pricing, only the percentage now.
Also, The percentage is always the same on every commodity, 7%.
Something changed upstream at the data source. I’m going to wait and see if it’s temporary, and if not, I’ll look into fixing. Thanks for the reports.
Not working after installing Mountain Lion operating system on the Mac. But I bet you already know that. Thanks. Hope you get it working, really use it for a quick look at the market.
I use your fine widget several times a day, mostly for watching the oil price go up and down and for a focus for cursing the futures brokers for their greed. The graph part seems to to work ok under Mountain Lion, but the numerical fields above that show the price and percentage have stopped working. Don’t listen to those rude people who think you owe them some kind of labor just because they exist. I appreciate your efforts very much.
The amounts are not showing for any of the products. We like to watch the
gold, silver and the US dollar amounts.
The graph works but the actual amount and percentage is not showing, just question marks. I am using OSX 10.4.11
Thanks for fixing widget. Much appreciated.
Yep, I wish it would show commodity prices for Live Cattle. Maybe one of the other posts already communicated this but I was in an hurry so I apologize if this is old request?
I’d like to see aluminum. The graph isn’t visually perfect text is off screen, etc. I hope its just the beginning for this widget. Bloomberg makes piles of money from a similar product…
Useful but sloppy. The x axis labels are not really very intuitive as far as understanding the time frame of the prices plotted, and anyway they are overwritten by the disclaimer. I can’t imagine why anyone would release a product in their name to the public with such a glaring bug.
Gold prices don’t fit in the box. The box is too small. I can’t read the x-axis labels because the text is overlapping at the bottom of the graph. I’m on OS X 10.10.3.
Great app. Please consider adding some World Stock Markets, FTSE, China, etc.
SINCE SATURDAY MY DASHBOARD ON MY APPLE, WHEN I HIT THE PLUS OIL COMES UP WHEN I TRY TO CHANGE THE COMMODITY BELOW COTTON. XFINITY POPS UP AND WANTS ME TO SIGN UP FOR SOMETHING. I HAVE DELETED DASHBOARD AND RELOADED, BUT IT CONTINUES TO NOT ACT CORRECTLY OR THE WAY IT USED TO. I HAVE USED THE INFORMATION FOR YEARS AND AM MORE THAN SATISFIED WITH THE ANSWERS TO COMMODIITY VALUES LISTED. ANY HELP WOULD BE GREAT. I WENT TO THE APPLE STORE IN ROSEVILLE MN. BUT THEY COULD NOT HELP. == THANKS TOM